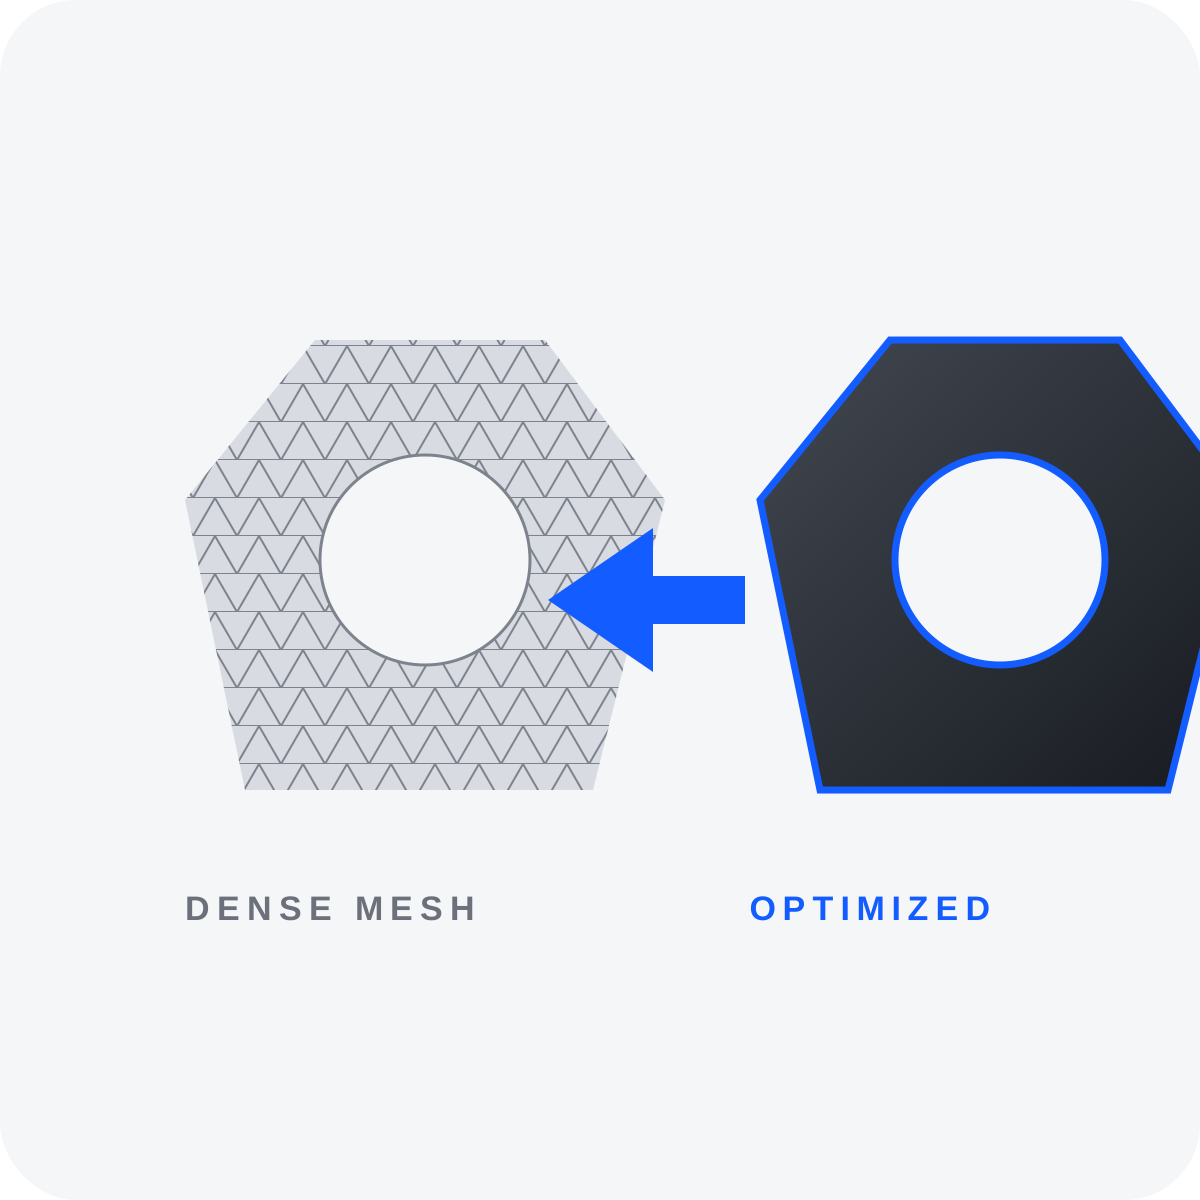
A model created for high-resolution rendering is not automatically suitable for a website.
Offline rendering software can process millions of polygons, large textures and complex materials over several minutes or hours.
A web browser must display the model in real time, often on a mobile phone with limited memory, battery power and graphics performance.
Optimization is the process of reducing this technical load while preserving the visual quality that matters to the customer.
Why 3D Models Need Web Optimization
A model prepared for advertising renders may contain:
— Millions of polygons
— Subdivision modifiers
— Hidden geometry
— Internal components
— Dozens of materials
— 4K or 8K textures
— Complex glass shaders
— Large animation files
— Unused cameras
— Unused lights
— Duplicate objects
— Rendering-specific data
These elements may be acceptable in a production scene but inefficient for real-time web delivery.
What Is the Goal of Optimization?
The goal is not to create the smallest possible file at any cost.
An excessively compressed model may load quickly but look inaccurate and unprofessional.
A good result balances:
Visual Quality
The product should retain its recognizable silhouette, materials and important details.
Loading Speed
The file should download within a reasonable time, including on mobile networks.
Runtime Performance
The model should rotate smoothly and remain stable on the target device.
Step 1: Define the Final Use Case
Before editing the model, determine how it will be used.
Product Viewer
The customer rotates the object and examines its details.
WebAR
The model is placed in a physical environment at real-world scale.
Product Configurator
The user changes colors, materials or components.
Technical Presentation
The model may include animation, labels, exploded views or removable parts.
Different use cases require different optimization decisions.
For example, internal components may be unnecessary for a furniture preview but essential for a technical exploded animation.
Step 2: Optimize the Geometry
Remove Invisible Geometry
Delete surfaces and details that the user will never see.
Examples may include:
— Internal walls
— Hidden screws
— Closed mechanical parts
— Unseen bottom surfaces
— Duplicate objects
— Geometry left from modifiers
Do not remove internal geometry if the product includes transparency, opening parts or an exploded animation.
Reduce Polygon Density
Excessive polygon density increases file size and rendering cost.
The largest reductions can often be made on:
— Flat surfaces
— Cylindrical objects with excessive segments
— Invisible internal components
— Small bevels
— Thread details
— Dense scanned surfaces
Important curves and silhouettes should be preserved.
Use Retopology
Automatic polygon reduction can create stretched triangles, uneven edges and shading problems.
Controlled retopology produces a cleaner and more predictable mesh.
It is particularly useful for:
— AI-generated models
— 3D scans
— Photogrammetry
— Sculpted objects
— Dense CAD conversions
— Models with damaged topology
Bake Small Details
Small details can often be represented with texture maps instead of geometry.
Examples include:
— Seams
— Fabric texture
— Small screws
— Surface relief
— Engraving
— Fine panel lines
— Minor bevels
A Normal Map can preserve the visual impression of detail without requiring thousands of additional polygons.
Suggested Polygon Ranges
There is no universal polygon limit for every web or AR project.
Performance also depends on materials, textures, transparency, animation, lighting and the number of objects in the scene.
The following values can be used as initial production targets for one product model:
Simple Product
Approximately 20,000–50,000 triangles.
Medium-Complexity Product
Approximately 50,000–120,000 triangles.
Detailed Product
Approximately 120,000–200,000 triangles, followed by careful testing.
These are practical starting points, not strict technical standards.
A well-organized model with more triangles may perform better than a smaller model with many materials, transparent surfaces and oversized textures.
Step 3: Check Normals and Smoothing
Incorrect normals can cause:
— Dark patches
— Broken lighting
— Invisible surfaces
— Unexpected transparency
— Visible seams
— Sharp transitions
— Distorted reflections
Before export, check:
— Face orientation
— Vertex normals
— Smoothing groups
— Sharp edges
— Duplicate vertices
— Open surfaces
— Negative scale
— Unapplied transformations
— Non-manifold geometry
— Overlapping faces
Shading should be tested again after export, not only inside the original 3D application.
Step 4: Prepare the UV Layout
UV mapping controls how two-dimensional textures are placed on the three-dimensional surface.
A web-ready UV layout should have:
— Minimal accidental overlap
— Suitable padding between islands
— Consistent texel density
— Efficient use of texture space
— Correct material direction
— No extremely small important islands
— No unnecessary empty space
— Predictable placement for product labels
Overlapping UVs can be useful for identical or symmetrical elements, but they may be unsuitable when unique details or baked lighting are required.
Step 5: Convert Materials to PBR
Offline renderers can use complex material systems that are not directly compatible with web viewers.
For real-time delivery, materials should normally be converted to a PBR workflow.
Base Color
Defines the visible surface color without directional lighting.
Metallic
Defines whether the surface behaves like a metal.
Roughness
Controls reflection sharpness.
Normal
Adds small surface detail without additional geometry.
Ambient Occlusion
Adds contact shading in recessed areas.
Emissive
Defines parts of the material that produce visible light.
Custom procedural materials may need to be baked into image textures.
Step 6: Reduce the Number of Materials
Every separate material can increase rendering overhead.
A product imported from CAD or an offline-rendering scene may contain many nearly identical materials.
Where practical:
— Merge duplicate materials
— Use shared material instances
— Combine textures into atlases
— Remove unused material slots
— Pack compatible texture channels
— Avoid unnecessary transparency
Material atlases are useful when parts do not need to change independently.
For a product configurator, separate materials may still be necessary for components whose colors or finishes must change.
Step 7: Optimize the Textures
Textures can occupy more space than the geometry itself.
Large images also consume device memory after loading.
1K Textures
Suitable for smaller objects, secondary parts and distant details.
2K Textures
A common choice for primary product models.
4K Textures
Useful only when close-up detail clearly requires the additional resolution.
8K Textures
Usually excessive for a single mobile web product and should be carefully justified.
Other texture optimization methods include:
— Cropping unused image space
— Removing unused textures
— Reducing unnecessary alpha channels
— Using efficient image compression
— Combining compatible maps
— Replacing flat-color images with material values
— Reusing textures across identical parts
Text on packaging should be checked carefully after texture resolution is reduced.
Step 8: Check Transparency
Transparency is expensive and can produce sorting problems.
It should be used only where required.
Prefer Opaque Materials When
— The surface is solid
— Transparency is not visible
— A fake reflection can provide the required appearance
— Mobile performance is a priority
Use Transparent Materials When
— The product contains real glass
— Internal components must remain visible
— The design depends on translucent material
— The final viewer handles transparency reliably
Glass materials should be tested on all target devices.
Step 9: Set Scale, Origin and Orientation
A correct model can still fail in AR if its scale or pivot is wrong.
1. Apply scale and rotation.
2. Use real-world dimensions.
3. Place the model on the ground level.
4. Set a logical pivot point.
5. Check the up axis.
6. Check the forward axis.
7. Remove unnecessary empty objects.
8. Verify the bounding box.
9. Confirm that no geometry is far from the origin.
10. Test placement in AR.
For furniture, the pivot is often placed at the center of the lowest contact area.
For doors, covers and rotating components, the pivot should correspond to the physical hinge.
Step 10: Optimize Animation
Animation can increase the size and complexity of a model.
Remove:
— Unused actions
— Empty keyframes
— Duplicate animation tracks
— Unnecessary bones
— Invisible animated objects
— Excessively dense keyframes
Looping animations should have a clean transition between the first and last frames.
Skeletal weights and moving components must be checked after export.
Step 11: Export the Correct Files
For most interactive website viewers, prepare an optimized GLB file.
For Apple AR Quick Look, prepare a USDZ file.
Keep the original editable scene or a suitable master file separately.
Source File
Used for future editing and production changes.
GLB File
Used for website display and compatible real-time workflows.
USDZ File
Used for AR presentation on compatible Apple devices.
Step 12: Optimize Loading on the Website
Even an optimized model does not always need to load immediately.
The website can use:
— Poster image
— Lazy loading
— Load-on-click
— Progress indicator
— Caching
— CDN delivery
— Mobile-specific quality
— Deferred scripts
— Compressed resources
— Fallback image
A poster image can show the product before the full model is downloaded.
This improves the initial appearance of the page and prevents unnecessary loading when the user does not interact with the 3D viewer.
Suggested GLB File Size Targets
File size depends on product complexity and visual requirements.
The following ranges can be used as practical starting points:
Under 5 MB
A lightweight model suitable for fast loading.
5–15 MB
A reasonable range for many detailed product models.
15–30 MB
Requires careful mobile testing and a clear quality justification.
Over 30 MB
Likely to produce slow loading on mobile connections and should be reviewed.
These figures are not strict standards.
A larger file may sometimes be justified, but its value should be clear to the user.
Geometry vs Textures: What Affects Performance More?
Factor · Main Effect
Polygon count · GPU processing and model complexity
Texture resolution · Download size and memory use
Number of materials · Draw calls and rendering overhead
Transparency · Rendering complexity and sorting issues
Animation · File size and runtime calculation
Number of separate objects · Scene management overhead
Shadows · GPU load
File compression · Download size
Device capability · Final runtime performance
Internet connection · Initial loading speed
Performance is determined by the complete asset, not by one number.
Final Pre-Publication Checklist
Geometry
— Correct scale
— Clean topology
— Correct normals
— No duplicate surfaces
— Hidden geometry removed
— Appropriate polygon density
— Logical object structure
Materials and Textures
— PBR-compatible materials
— Reasonable texture resolution
— No missing images
— No unused textures
— Transparency tested
— Material count optimized
— Product labels remain readable
Website and AR
— GLB tested
— USDZ tested
— Mobile performance checked
— Correct AR placement
— Poster image added
— Loading behavior tested
— Unsupported-device fallback added
Frequently Asked Questions
How can I reduce the size of a GLB file?
Reduce unnecessary geometry, optimize texture resolution, remove unused data, simplify materials and apply suitable compression.
What is more important: polygon count or texture size?
Both matter. Materials, transparency, animation and scene structure also affect performance.
Can a 3D model be optimized automatically?
Automatic tools can help, but the result should be inspected manually. Silhouette, UVs, materials, animation and shading may be damaged during automatic reduction.
Why does a model look different in Blender and a browser?
Different applications use different lighting, color management, material systems and supported features. Always test the model inside the final web viewer.
Conclusion
Optimizing a 3D model for websites and WebAR is not simply a matter of exporting it to GLB.
The process includes geometry reduction, retopology, material conversion, texture optimization, scale correction and testing on real devices.
I optimize 3D models for websites, online stores, product configurators and augmented reality. Services can include retopology, UV preparation, PBR materials, GLB optimization and USDZ export.